|
FY2018 House 1 |
FY2018 House Final |
FY2018 Senate Final |
FY2018 GAA |
|
|---|---|---|---|---|
| Budget Tracking | 31,335,559 | 31,530,559 | 32,010,559 | 31,355,559 |
|
FY2015 GAA |
FY2016 GAA |
FY2017 GAA |
FY2017 Projected |
FY2018 GAA |
|
|---|---|---|---|---|---|
| Historical Budget Levels | 5,827,078 | 5,760,068 | 30,907,153 | 30,422,531 | 31,355,559 |
* GAA is General Appropriation Act.
| SPENDING CATEGORY |
FY2014 Expended |
FY2015 Expended |
FY2016 Expended |
FY2017 Projected |
FY2018 GAA |
|---|---|---|---|---|---|
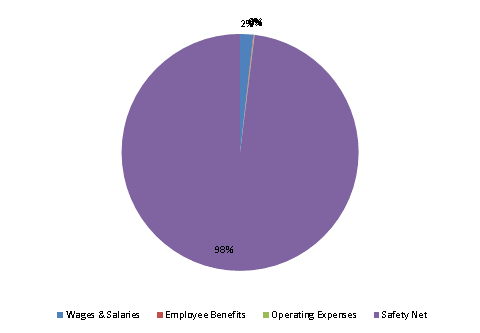
| Wages & Salaries | 135 | 161 | 211 | 284 | 562 |
| Employee Benefits | 4 | 5 | 6 | 11 | 27 |
| Operating Expenses | 0 | 0 | 0 | 26 | 26 |
| Safety Net | 5,538 | 5,525 | 6,144 | 30,102 | 30,742 |
| TOTAL | 5,677 | 5,691 | 6,361 | 30,423 | 31,356 |
FY2018 Spending Category Chart
