|
FY2018 House 1 |
FY2018 House Final |
FY2018 Senate Final |
FY2018 GAA |
|
|---|---|---|---|---|
| Budget Tracking | 4,140,051 | 4,230,748 | 4,390,051 | 4,340,051 |
|
FY2015 GAA |
FY2016 GAA |
FY2017 GAA |
FY2017 Projected |
FY2018 GAA |
|
|---|---|---|---|---|---|
| Historical Budget Levels | 4,000,000 | 3,953,741 | 4,180,748 | 3,863,632 | 4,340,051 |
* GAA is General Appropriation Act.
| SPENDING CATEGORY |
FY2014 Expended |
FY2015 Expended |
FY2016 Expended |
FY2017 Projected |
FY2018 GAA |
|---|---|---|---|---|---|
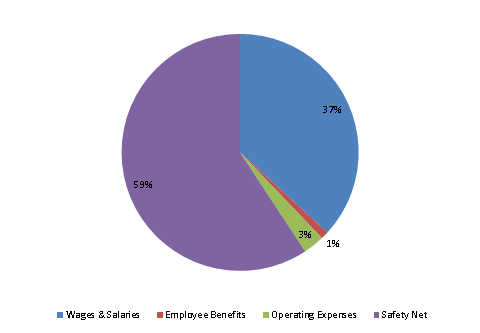
| Wages & Salaries | 1,098 | 1,094 | 1,357 | 1,275 | 1,598 |
| Employee Benefits | 25 | 19 | 24 | 43 | 45 |
| Operating Expenses | 328 | 191 | 112 | 120 | 126 |
| Safety Net | 2,329 | 2,481 | 2,795 | 2,426 | 2,571 |
| Grants & Subsidies | 5 | 0 | 0 | 0 | 0 |
| TOTAL | 3,784 | 3,785 | 4,288 | 3,864 | 4,340 |
FY2018 Spending Category Chart
