|
FY2018 House 1 |
FY2018 House Final |
FY2018 Senate Final |
FY2018 GAA |
|
|---|---|---|---|---|
| Budget Tracking | 31,123,238 | 31,123,238 | 31,123,238 | 29,300,167 |
|
FY2015 GAA |
FY2016 GAA |
FY2017 GAA |
FY2017 Projected |
FY2018 GAA |
|
|---|---|---|---|---|---|
| Historical Budget Levels | 27,420,583 | 27,600,167 | 28,550,167 | 28,623,825 | 29,300,167 |
* GAA is General Appropriation Act.
| SPENDING CATEGORY |
FY2014 Expended |
FY2015 Expended |
FY2016 Expended |
FY2017 Projected |
FY2018 GAA |
|---|---|---|---|---|---|
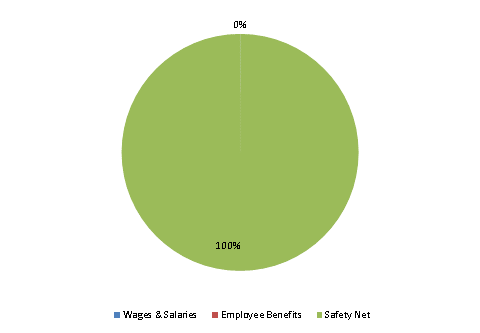
| Wages & Salaries | 58 | 59 | 9 | 8 | 7 |
| Employee Benefits | 4 | 3 | 0 | 2 | 2 |
| Safety Net | 27,180 | 24,647 | 25,819 | 28,614 | 29,291 |
| TOTAL | 27,243 | 24,710 | 25,828 | 28,624 | 29,300 |
FY2018 Spending Category Chart
