|
FY2018 House 1 |
FY2018 House Final |
FY2018 Senate Final |
FY2018 GAA |
|
|---|---|---|---|---|
| Budget Tracking | 127,675,888 | 133,750,888 | 129,875,888 | 132,575,888 |
|
FY2015 GAA |
FY2016 GAA |
FY2017 GAA |
FY2017 Projected |
FY2018 GAA |
|
|---|---|---|---|---|---|
| Historical Budget Levels | 91,317,333 | 90,424,904 | 125,692,987 | 119,934,999 | 132,575,888 |
* GAA is General Appropriation Act.
| SPENDING CATEGORY |
FY2014 Expended |
FY2015 Expended |
FY2016 Expended |
FY2017 Projected |
FY2018 GAA |
|---|---|---|---|---|---|
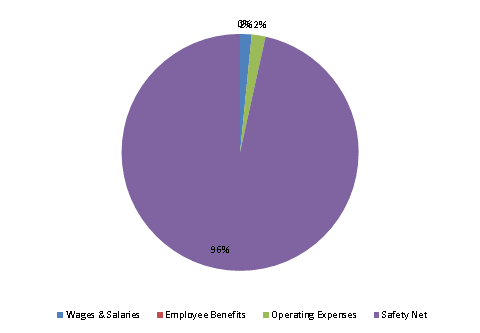
| Wages & Salaries | 1,102 | 1,173 | 1,517 | 2,001 | 2,079 |
| Employee Benefits | 6 | 13 | 10 | 12 | 12 |
| Operating Expenses | 551 | 710 | 1,407 | 1,239 | 2,495 |
| Safety Net | 80,975 | 89,613 | 104,327 | 116,684 | 127,989 |
| Grants & Subsidies | 0 | 0 | 765 | 0 | 0 |
| TOTAL | 82,634 | 91,509 | 108,026 | 119,935 | 132,576 |
FY2018 Spending Category Chart
