|
FY2018 House 1 |
FY2018 House Final |
FY2018 Senate Final |
FY2018 GAA |
|
|---|---|---|---|---|
| Budget Tracking | 28,334,416 | 30,334,416 | 31,270,279 | 30,834,416 |
|
FY2015 GAA |
FY2016 GAA |
FY2017 GAA |
FY2017 Projected |
FY2018 GAA |
|
|---|---|---|---|---|---|
| Historical Budget Levels | 32,229,847 | 29,911,301 | 33,134,598 | 30,306,310 | 30,834,416 |
* GAA is General Appropriation Act.
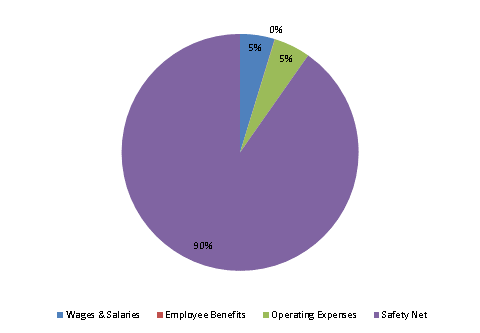
| SPENDING CATEGORY |
FY2014 Expended |
FY2015 Expended |
FY2016 Expended |
FY2017 Projected |
FY2018 GAA |
|---|---|---|---|---|---|
| Wages & Salaries | 698 | 683 | 991 | 1,054 | 1,453 |
| Employee Benefits | 9 | 10 | 11 | 12 | 15 |
| Operating Expenses | 1,129 | 1,162 | 1,811 | 1,411 | 1,535 |
| Safety Net | 29,492 | 29,261 | 28,954 | 27,830 | 27,831 |
| TOTAL | 31,328 | 31,115 | 31,767 | 30,306 | 30,834 |
FY2018 Spending Category Chart