|
FY2018 House 1 |
FY2018 House Final |
FY2018 Senate Final |
FY2018 GAA |
|
|---|---|---|---|---|
| Budget Tracking | 1,164,216 | 1,164,216 | 1,164,216 | 1,129,290 |
|
FY2015 GAA |
FY2016 GAA |
FY2017 GAA |
FY2017 Projected |
FY2018 GAA |
|
|---|---|---|---|---|---|
| Historical Budget Levels | 1,330,377 | 1,292,013 | 1,207,002 | 1,194,931 | 1,129,290 |
* GAA is General Appropriation Act.
| SPENDING CATEGORY |
FY2014 Expended |
FY2015 Expended |
FY2016 Expended |
FY2017 Projected |
FY2018 GAA |
|---|---|---|---|---|---|
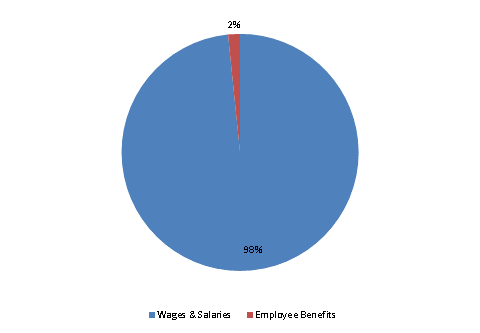
| Wages & Salaries | 1,253 | 1,280 | 1,200 | 1,175 | 1,111 |
| Employee Benefits | 23 | 34 | 20 | 20 | 18 |
| TOTAL | 1,276 | 1,314 | 1,220 | 1,195 | 1,129 |
FY2018 Spending Category Chart
