|
FY2018 House 1 |
FY2018 House Final |
FY2018 Senate Final |
FY2018 GAA |
|
|---|---|---|---|---|
| Budget Tracking | 3,738,321 | 3,798,322 | 3,918,321 | 3,688,322 |
|
FY2015 GAA |
FY2016 GAA |
FY2017 GAA |
FY2017 Projected |
FY2018 GAA |
|
|---|---|---|---|---|---|
| Historical Budget Levels | 4,432,349 | 4,227,791 | 3,938,554 | 3,745,125 | 3,688,322 |
* GAA is General Appropriation Act.
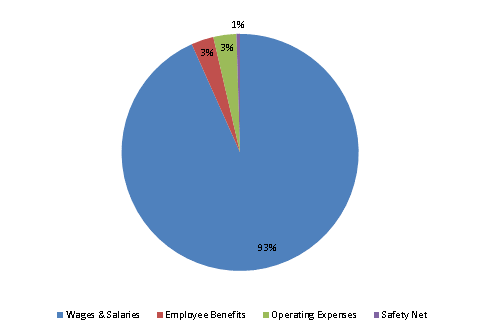
| SPENDING CATEGORY |
FY2014 Expended |
FY2015 Expended |
FY2016 Expended |
FY2017 Projected |
FY2018 GAA |
|---|---|---|---|---|---|
| Wages & Salaries | 3,674 | 4,147 | 3,340 | 3,503 | 3,442 |
| Employee Benefits | 92 | 106 | 101 | 115 | 113 |
| Operating Expenses | 224 | 61 | 114 | 118 | 116 |
| Safety Net | 6 | 12 | 18 | 9 | 18 |
| TOTAL | 3,996 | 4,326 | 3,572 | 3,745 | 3,688 |
FY2018 Spending Category Chart