|
FY2018 House 1 |
FY2018 House Final |
FY2018 Senate Final |
FY2018 GAA |
|
|---|---|---|---|---|
| Budget Tracking | 692,354 | 1,142,354 | 1,542,354 | 1,592,354 |
|
FY2015 GAA |
FY2016 GAA |
FY2017 GAA |
FY2017 Projected |
FY2018 GAA |
|
|---|---|---|---|---|---|
| Historical Budget Levels | 1,737,593 | 794,775 | 1,598,773 | 1,135,403 | 1,592,354 |
* GAA is General Appropriation Act.
| SPENDING CATEGORY |
FY2014 Expended |
FY2015 Expended |
FY2016 Expended |
FY2017 Projected |
FY2018 GAA |
|---|---|---|---|---|---|
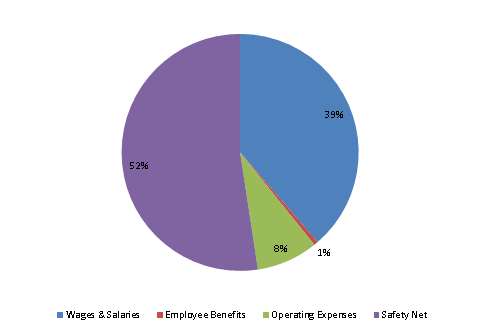
| Wages & Salaries | 399 | 234 | 204 | 266 | 615 |
| Employee Benefits | 2 | 2 | 3 | 4 | 9 |
| Operating Expenses | 37 | 38 | 38 | 54 | 133 |
| Safety Net | 525 | 877 | 1,011 | 812 | 835 |
| Grants & Subsidies | 0 | 150 | 0 | 0 | 0 |
| TOTAL | 964 | 1,301 | 1,255 | 1,135 | 1,592 |
FY2018 Spending Category Chart
