|
FY2018 House 1 |
FY2018 House Final |
FY2018 Senate Final |
FY2018 GAA |
|
|---|---|---|---|---|
| Budget Tracking | 17,717,687 | 17,717,688 | 17,717,687 | 17,438,231 |
|
FY2015 GAA |
FY2016 GAA |
FY2017 GAA |
FY2017 Projected |
FY2018 GAA |
|
|---|---|---|---|---|---|
| Historical Budget Levels | 20,055,370 | 18,938,083 | 17,852,074 | 17,730,353 | 17,438,231 |
* GAA is General Appropriation Act.
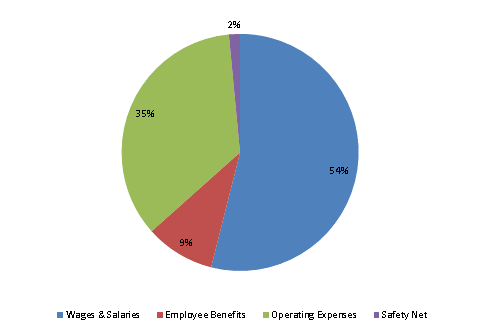
| SPENDING CATEGORY |
FY2014 Expended |
FY2015 Expended |
FY2016 Expended |
FY2017 Projected |
FY2018 GAA |
|---|---|---|---|---|---|
| Wages & Salaries | 10,600 | 11,006 | 9,328 | 9,776 | 9,406 |
| Employee Benefits | 1,765 | 1,678 | 1,629 | 1,677 | 1,651 |
| Operating Expenses | 5,187 | 5,515 | 5,783 | 5,841 | 6,118 |
| Safety Net | 690 | 367 | 367 | 283 | 263 |
| Grants & Subsidies | 153 | 153 | 153 | 153 | 0 |
| TOTAL | 18,395 | 18,720 | 17,261 | 17,730 | 17,438 |
FY2018 Spending Category Chart