|
FY2018 House 1 |
FY2018 House Final |
FY2018 Senate Final |
FY2018 GAA |
|
|---|---|---|---|---|
| Budget Tracking | 225,414,972 | 222,400,139 | 222,400,140 | 220,233,607 |
|
FY2015 GAA |
FY2016 GAA |
FY2017 GAA |
FY2017 Projected |
FY2018 GAA |
|
|---|---|---|---|---|---|
| Historical Budget Levels | 234,343,661 | 228,738,399 | 224,808,227 | 215,337,268 | 220,233,607 |
* GAA is General Appropriation Act.
| SPENDING CATEGORY |
FY2014 Expended |
FY2015 Expended |
FY2016 Expended |
FY2017 Projected |
FY2018 GAA |
|---|---|---|---|---|---|
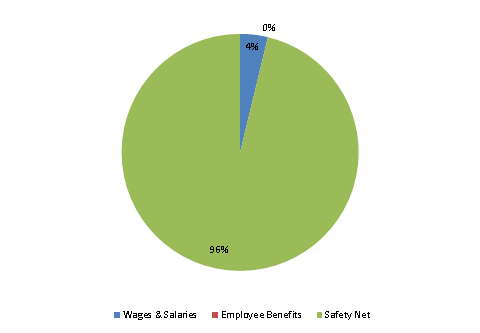
| Wages & Salaries | 6,399 | 7,514 | 9,291 | 8,486 | 8,298 |
| Employee Benefits | 7 | 8 | 9 | 10 | 9 |
| Safety Net | 219,991 | 215,130 | 214,950 | 206,841 | 211,926 |
| TOTAL | 226,397 | 222,652 | 224,250 | 215,337 | 220,234 |
FY2018 Spending Category Chart
