|
FY2018 House 1 |
FY2018 House Final |
FY2018 Senate Final |
FY2018 GAA |
|
|---|---|---|---|---|
| Budget Tracking | 10,034,729 | 10,034,729 | 10,034,729 | 10,029,832 |
|
FY2015 GAA |
FY2016 GAA |
FY2017 GAA |
FY2017 Projected |
FY2018 GAA |
|
|---|---|---|---|---|---|
| Historical Budget Levels | 9,347,502 | 9,854,932 | 10,029,832 | 8,200,247 | 10,029,832 |
* GAA is General Appropriation Act.
| SPENDING CATEGORY |
FY2014 Expended |
FY2015 Expended |
FY2016 Expended |
FY2017 Projected |
FY2018 GAA |
|---|---|---|---|---|---|
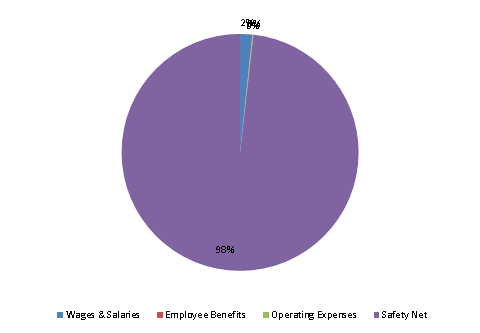
| Wages & Salaries | 142 | 140 | 152 | 160 | 165 |
| Employee Benefits | 3 | 3 | 4 | 5 | 5 |
| Operating Expenses | 4 | 4 | 6 | 7 | 10 |
| Safety Net | 7,261 | 7,930 | 8,371 | 8,028 | 9,850 |
| TOTAL | 7,410 | 8,078 | 8,534 | 8,200 | 10,030 |
FY2018 Spending Category Chart
