|
FY2018 House 1 |
FY2018 House Final |
FY2018 Senate Final |
FY2018 GAA |
|
|---|---|---|---|---|
| Budget Tracking | 14,598,659 | 13,673,659 | 14,673,659 | 14,185,888 |
|
FY2015 GAA |
FY2016 GAA |
FY2017 GAA |
FY2017 Projected |
FY2018 GAA |
|
|---|---|---|---|---|---|
| Historical Budget Levels | 11,802,537 | 11,806,041 | 12,694,060 | 12,620,876 | 14,185,888 |
* GAA is General Appropriation Act.
| SPENDING CATEGORY |
FY2014 Expended |
FY2015 Expended |
FY2016 Expended |
FY2017 Projected |
FY2018 GAA |
|---|---|---|---|---|---|
| Wages & Salaries | 77 | 89 | 66 | 128 | 128 |
| Employee Benefits | 1 | 2 | 1 | 3 | 3 |
| Operating Expenses | 0 | 0 | 0 | 0 | 0 |
| Safety Net | 6,995 | 9,775 | 12,212 | 12,489 | 14,054 |
| TOTAL | 7,074 | 9,866 | 12,279 | 12,621 | 14,186 |
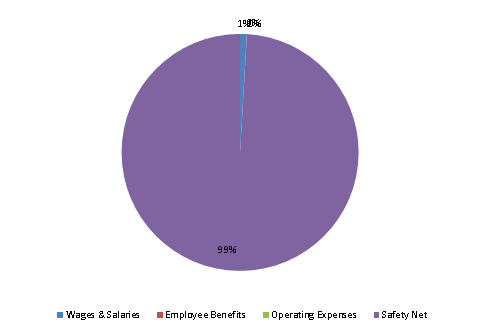
FY2018 Spending Category Chart