|
FY2018 House 1 |
FY2018 House Final |
FY2018 Senate Final |
FY2018 GAA |
|
|---|---|---|---|---|
| Budget Tracking | 63,364,465 | 63,321,110 | 63,346,109 | 62,335,765 |
|
FY2015 GAA |
FY2016 GAA |
FY2017 GAA |
FY2017 Projected |
FY2018 GAA |
|
|---|---|---|---|---|---|
| Historical Budget Levels | 61,079,500 | 65,148,736 | 65,231,263 | 59,997,336 | 62,335,765 |
* GAA is General Appropriation Act.
| SPENDING CATEGORY |
FY2014 Expended |
FY2015 Expended |
FY2016 Expended |
FY2017 Projected |
FY2018 GAA |
|---|---|---|---|---|---|
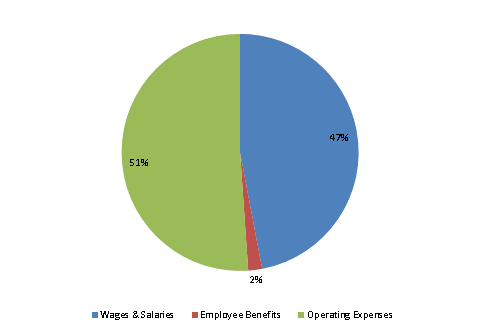
| Wages & Salaries | 26,534 | 28,625 | 27,259 | 28,963 | 29,309 |
| Employee Benefits | 727 | 934 | 1,004 | 1,155 | 1,175 |
| Operating Expenses | 31,878 | 29,955 | 28,668 | 29,879 | 31,852 |
| TOTAL | 59,139 | 59,515 | 56,931 | 59,997 | 62,336 |
FY2018 Spending Category Chart
