|
FY2018 House 1 |
FY2018 House Final |
FY2018 Senate Final |
FY2018 GAA |
|
|---|---|---|---|---|
| Budget Tracking | 119,987,019 | 119,987,020 | 119,987,019 | 118,863,123 |
|
FY2015 GAA |
FY2016 GAA |
FY2017 GAA |
FY2017 Projected |
FY2018 GAA |
|
|---|---|---|---|---|---|
| Historical Budget Levels | 118,064,994 | 116,251,547 | 116,373,492 | 112,749,892 | 118,863,123 |
* GAA is General Appropriation Act.
| SPENDING CATEGORY |
FY2014 Expended |
FY2015 Expended |
FY2016 Expended |
FY2017 Projected |
FY2018 GAA |
|---|---|---|---|---|---|
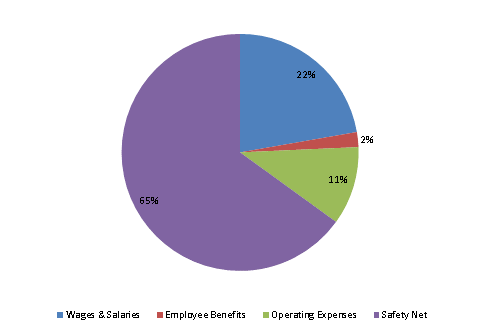
| Wages & Salaries | 22,832 | 24,266 | 24,199 | 25,831 | 26,447 |
| Employee Benefits | 1,817 | 1,702 | 2,866 | 2,436 | 2,424 |
| Operating Expenses | 12,005 | 11,145 | 10,954 | 12,280 | 12,710 |
| Safety Net | 70,749 | 75,025 | 74,601 | 72,202 | 77,282 |
| TOTAL | 107,404 | 112,138 | 112,619 | 112,750 | 118,863 |
FY2018 Spending Category Chart
