|
FY2018 House 1 |
FY2018 House Final |
FY2018 Senate Final |
FY2018 GAA |
|
|---|---|---|---|---|
| Budget Tracking | 28,529,665 | 28,529,665 | 29,029,665 | 28,581,402 |
|
FY2015 GAA |
FY2016 GAA |
FY2017 GAA |
FY2017 Projected |
FY2018 GAA |
|
|---|---|---|---|---|---|
| Historical Budget Levels | 25,966,365 | 26,687,833 | 27,633,139 | 27,390,876 | 28,581,402 |
* GAA is General Appropriation Act.
| SPENDING CATEGORY |
FY2014 Expended |
FY2015 Expended |
FY2016 Expended |
FY2017 Projected |
FY2018 GAA |
|---|---|---|---|---|---|
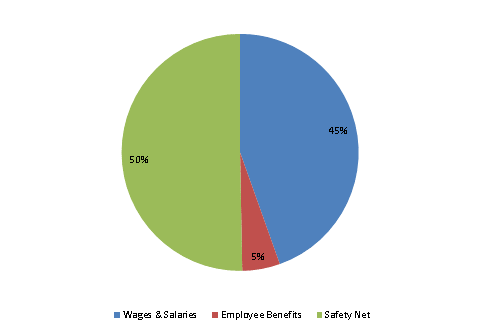
| Wages & Salaries | 10,554 | 10,966 | 11,193 | 11,825 | 12,736 |
| Employee Benefits | 890 | 1,448 | 1,296 | 1,457 | 1,473 |
| Operating Expenses | 2 | 0 | 0 | 0 | 0 |
| Safety Net | 11,362 | 12,859 | 13,627 | 14,108 | 14,373 |
| TOTAL | 22,808 | 25,273 | 26,116 | 27,391 | 28,581 |
FY2018 Spending Category Chart