|
FY2018 House 1 |
FY2018 House Final |
FY2018 Senate Final |
FY2018 GAA |
|
|---|---|---|---|---|
| Budget Tracking | 23,680,137 | 23,530,858 | 23,680,136 | 23,355,341 |
|
FY2015 GAA |
FY2016 GAA |
FY2017 GAA |
FY2017 Projected |
FY2018 GAA |
|
|---|---|---|---|---|---|
| Historical Budget Levels | 22,617,744 | 23,286,596 | 23,179,824 | 22,661,146 | 23,355,341 |
* GAA is General Appropriation Act.
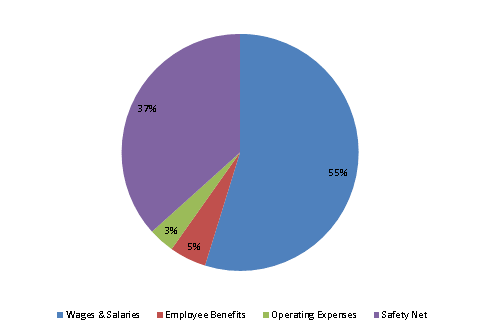
| SPENDING CATEGORY |
FY2014 Expended |
FY2015 Expended |
FY2016 Expended |
FY2017 Projected |
FY2018 GAA |
|---|---|---|---|---|---|
| Wages & Salaries | 11,515 | 11,979 | 11,984 | 12,598 | 12,795 |
| Employee Benefits | 1,165 | 1,229 | 1,250 | 1,184 | 1,171 |
| Operating Expenses | 840 | 882 | 743 | 769 | 828 |
| Safety Net | 8,383 | 7,609 | 7,894 | 8,110 | 8,561 |
| TOTAL | 21,903 | 21,698 | 21,871 | 22,661 | 23,355 |
FY2018 Spending Category Chart