|
FY2018 House 1 |
FY2018 House Final |
FY2018 Senate Final |
FY2018 GAA |
|
|---|---|---|---|---|
| Budget Tracking | 22,755,294 | 22,755,294 | 22,755,294 | 22,592,998 |
|
FY2015 GAA |
FY2016 GAA |
FY2017 GAA |
FY2017 Projected |
FY2018 GAA |
|
|---|---|---|---|---|---|
| Historical Budget Levels | 21,482,106 | 23,170,537 | 22,592,998 | 22,213,885 | 22,592,998 |
* GAA is General Appropriation Act.
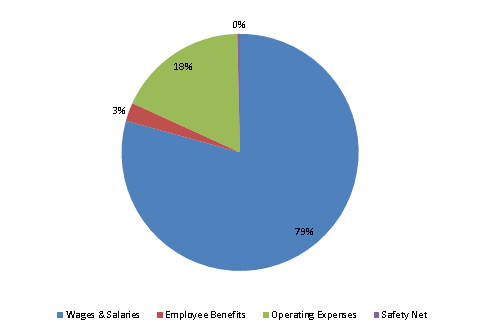
| SPENDING CATEGORY |
FY2014 Expended |
FY2015 Expended |
FY2016 Expended |
FY2017 Projected |
FY2018 GAA |
|---|---|---|---|---|---|
| Wages & Salaries | 16,174 | 16,668 | 17,228 | 17,754 | 17,916 |
| Employee Benefits | 420 | 503 | 547 | 573 | 568 |
| Operating Expenses | 4,221 | 4,238 | 3,800 | 3,820 | 4,023 |
| Safety Net | 75 | 76 | 139 | 67 | 86 |
| TOTAL | 20,890 | 21,485 | 21,714 | 22,214 | 22,593 |
FY2018 Spending Category Chart