|
FY2018 House 1 |
FY2018 House Final |
FY2018 Senate Final |
FY2018 GAA |
|
|---|---|---|---|---|
| Budget Tracking | 27,213,618 | 27,213,617 | 27,213,618 | 27,210,690 |
|
FY2015 GAA |
FY2016 GAA |
FY2017 GAA |
FY2017 Projected |
FY2018 GAA |
|
|---|---|---|---|---|---|
| Historical Budget Levels | 27,732,672 | 29,539,153 | 27,210,690 | 26,890,060 | 27,210,690 |
* GAA is General Appropriation Act.
| SPENDING CATEGORY |
FY2014 Expended |
FY2015 Expended |
FY2016 Expended |
FY2017 Projected |
FY2018 GAA |
|---|---|---|---|---|---|
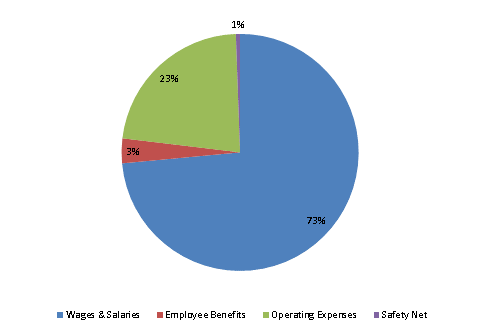
| Wages & Salaries | 19,624 | 20,388 | 18,643 | 19,789 | 20,005 |
| Employee Benefits | 757 | 916 | 897 | 849 | 917 |
| Operating Expenses | 6,355 | 5,900 | 6,378 | 6,130 | 6,132 |
| Safety Net | 46 | 51 | 71 | 121 | 157 |
| TOTAL | 26,781 | 27,255 | 25,988 | 26,890 | 27,211 |
FY2018 Spending Category Chart
