|
FY2018 House 1 |
FY2018 House Final |
FY2018 Senate Final |
FY2018 GAA |
|
|---|---|---|---|---|
| Budget Tracking | 5,598,262 | 5,598,262 | 5,904,674 | 5,548,262 |
|
FY2015 GAA |
FY2016 GAA |
FY2017 GAA |
FY2017 Projected |
FY2018 GAA |
|
|---|---|---|---|---|---|
| Historical Budget Levels | 5,780,713 | 5,645,031 | 5,611,403 | 5,330,811 | 5,548,262 |
* GAA is General Appropriation Act.
| SPENDING CATEGORY |
FY2014 Expended |
FY2015 Expended |
FY2016 Expended |
FY2017 Projected |
FY2018 GAA |
|---|---|---|---|---|---|
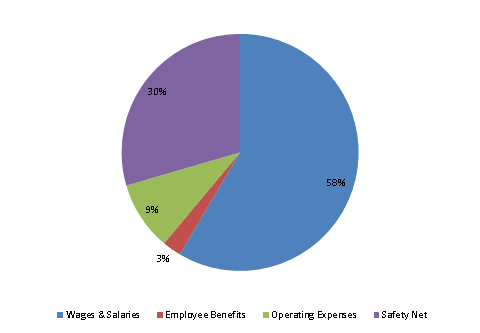
| Wages & Salaries | 3,149 | 3,340 | 3,029 | 3,275 | 3,246 |
| Employee Benefits | 140 | 147 | 141 | 146 | 142 |
| Operating Expenses | 618 | 598 | 532 | 601 | 523 |
| Safety Net | 1,604 | 1,495 | 1,507 | 1,310 | 1,637 |
| TOTAL | 5,512 | 5,581 | 5,208 | 5,331 | 5,548 |
FY2018 Spending Category Chart
