|
FY2018 House 1 |
FY2018 House Final |
FY2018 Senate Final |
FY2018 GAA |
|
|---|---|---|---|---|
| Budget Tracking | 4,320,431 | 4,320,430 | 4,320,431 | 4,313,482 |
|
FY2015 GAA |
FY2016 GAA |
FY2017 GAA |
FY2017 Projected |
FY2018 GAA |
|
|---|---|---|---|---|---|
| Historical Budget Levels | 4,280,684 | 4,306,174 | 4,313,482 | 4,202,916 | 4,313,482 |
* GAA is General Appropriation Act.
| SPENDING CATEGORY |
FY2014 Expended |
FY2015 Expended |
FY2016 Expended |
FY2017 Projected |
FY2018 GAA |
|---|---|---|---|---|---|
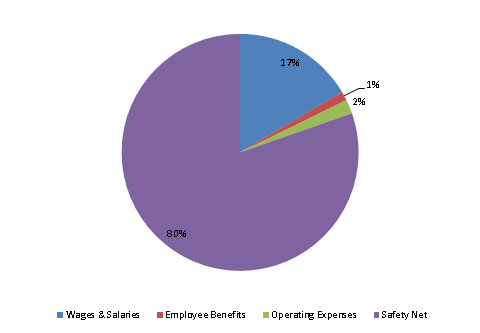
| Wages & Salaries | 696 | 742 | 688 | 714 | 711 |
| Employee Benefits | 52 | 54 | 52 | 54 | 54 |
| Operating Expenses | 84 | 84 | 83 | 83 | 83 |
| Safety Net | 3,350 | 3,363 | 3,408 | 3,351 | 3,466 |
| TOTAL | 4,182 | 4,242 | 4,231 | 4,203 | 4,313 |
FY2018 Spending Category Chart
