|
FY2018 House 1 |
FY2018 House Final |
FY2018 Senate Final |
FY2018 GAA |
|
|---|---|---|---|---|
| Budget Tracking | 9,481,551 | 9,481,551 | 9,681,551 | 9,623,606 |
|
FY2015 GAA |
FY2016 GAA |
FY2017 GAA |
FY2017 Projected |
FY2018 GAA |
|
|---|---|---|---|---|---|
| Historical Budget Levels | 8,832,510 | 8,777,574 | 9,423,606 | 9,129,455 | 9,623,606 |
* GAA is General Appropriation Act.
| SPENDING CATEGORY |
FY2014 Expended |
FY2015 Expended |
FY2016 Expended |
FY2017 Projected |
FY2018 GAA |
|---|---|---|---|---|---|
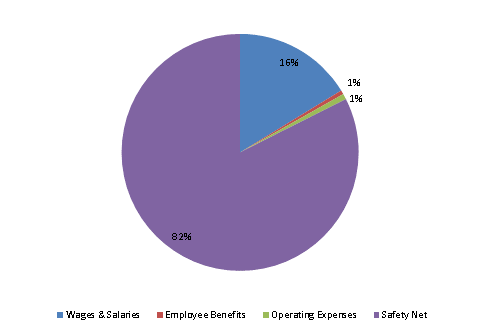
| Wages & Salaries | 1,251 | 1,321 | 1,359 | 1,521 | 1,564 |
| Employee Benefits | 49 | 45 | 44 | 52 | 53 |
| Operating Expenses | 72 | 90 | 69 | 73 | 74 |
| Safety Net | 6,765 | 6,587 | 7,444 | 7,483 | 7,932 |
| TOTAL | 8,136 | 8,043 | 8,917 | 9,129 | 9,624 |
FY2018 Spending Category Chart
