|
FY2018 House 1 |
FY2018 House Final |
FY2018 Senate Final |
FY2018 GAA |
|
|---|---|---|---|---|
| Budget Tracking | 354,813 | 354,814 | 354,813 | 346,486 |
|
FY2015 GAA |
FY2016 GAA |
FY2017 GAA |
FY2017 Projected |
FY2018 GAA |
|
|---|---|---|---|---|---|
| Historical Budget Levels | 419,522 | 430,981 | 346,486 | 344,572 | 346,486 |
* GAA is General Appropriation Act.
| SPENDING CATEGORY |
FY2014 Expended |
FY2015 Expended |
FY2016 Expended |
FY2017 Projected |
FY2018 GAA |
|---|---|---|---|---|---|
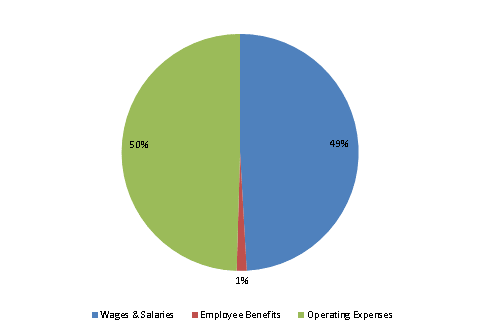
| Wages & Salaries | 238 | 231 | 228 | 164 | 170 |
| Employee Benefits | 4 | 6 | 6 | 5 | 5 |
| Operating Expenses | 164 | 167 | 183 | 176 | 172 |
| TOTAL | 406 | 404 | 417 | 345 | 346 |
FY2018 Spending Category Chart
