|
FY2018 House 1 |
FY2018 House Final |
FY2018 Senate Final |
FY2018 GAA |
|
|---|---|---|---|---|
| Budget Tracking | 3,342,303 | 3,342,303 | 3,342,303 | 3,340,735 |
|
FY2015 GAA |
FY2016 GAA |
FY2017 GAA |
FY2017 Projected |
FY2018 GAA |
|
|---|---|---|---|---|---|
| Historical Budget Levels | 3,353,118 | 3,007,613 | 3,340,735 | 3,326,104 | 3,340,735 |
* GAA is General Appropriation Act.
| SPENDING CATEGORY |
FY2014 Expended |
FY2015 Expended |
FY2016 Expended |
FY2017 Projected |
FY2018 GAA |
|---|---|---|---|---|---|
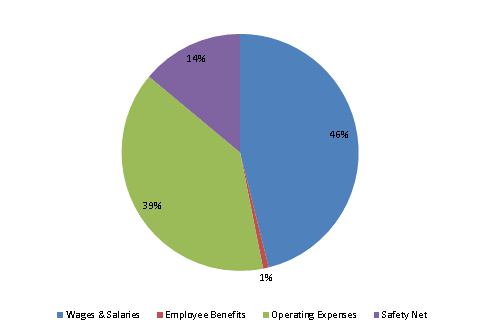
| Wages & Salaries | 1,330 | 1,398 | 1,519 | 1,540 | 1,541 |
| Employee Benefits | 19 | 22 | 25 | 26 | 26 |
| Operating Expenses | 1,310 | 1,312 | 1,279 | 1,306 | 1,308 |
| Safety Net | 559 | 423 | 439 | 454 | 466 |
| TOTAL | 3,219 | 3,155 | 3,262 | 3,326 | 3,341 |
FY2018 Spending Category Chart
