|
FY2018 House 1 |
FY2018 House Final |
FY2018 Senate Final |
FY2018 GAA |
|
|---|---|---|---|---|
| Budget Tracking | 13,767,655 | 13,767,655 | 13,767,655 | 13,575,558 |
|
FY2015 GAA |
FY2016 GAA |
FY2017 GAA |
FY2017 Projected |
FY2018 GAA |
|
|---|---|---|---|---|---|
| Historical Budget Levels | 13,010,253 | 13,167,056 | 13,183,460 | 12,911,116 | 13,575,558 |
* GAA is General Appropriation Act.
| SPENDING CATEGORY |
FY2014 Expended |
FY2015 Expended |
FY2016 Expended |
FY2017 Projected |
FY2018 GAA |
|---|---|---|---|---|---|
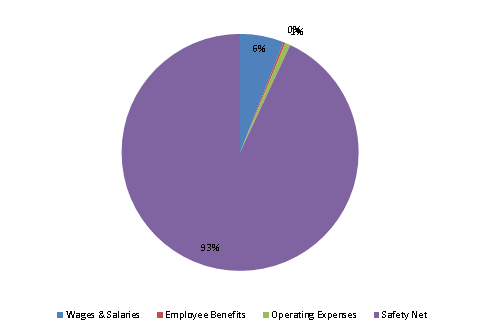
| Wages & Salaries | 851 | 897 | 801 | 944 | 811 |
| Employee Benefits | 26 | 31 | 37 | 37 | 37 |
| Operating Expenses | 116 | 109 | 96 | 91 | 98 |
| Safety Net | 10,580 | 11,578 | 11,748 | 11,839 | 12,630 |
| TOTAL | 11,572 | 12,615 | 12,682 | 12,911 | 13,576 |
FY2018 Spending Category Chart
