|
FY2018 House 1 |
FY2018 House Final |
FY2018 Senate Final |
FY2018 GAA |
|
|---|---|---|---|---|
| Budget Tracking | 4,207,203 | 4,350,682 | 4,500,000 | 4,175,682 |
|
FY2015 GAA |
FY2016 GAA |
FY2017 GAA |
FY2017 Projected |
FY2018 GAA |
|
|---|---|---|---|---|---|
| Historical Budget Levels | 4,070,352 | 4,204,928 | 4,350,682 | 4,053,321 | 4,175,682 |
* GAA is General Appropriation Act.
| SPENDING CATEGORY |
FY2014 Expended |
FY2015 Expended |
FY2016 Expended |
FY2017 Projected |
FY2018 GAA |
|---|---|---|---|---|---|
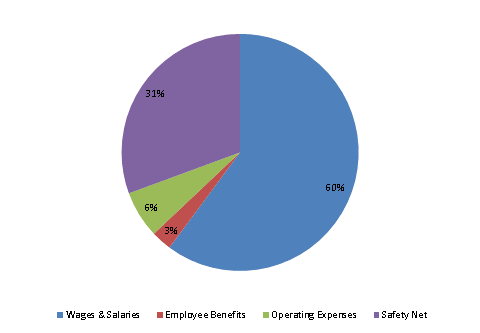
| Wages & Salaries | 2,358 | 2,460 | 2,266 | 2,524 | 2,512 |
| Employee Benefits | 106 | 111 | 125 | 118 | 117 |
| Operating Expenses | 245 | 246 | 241 | 250 | 268 |
| Safety Net | 1,200 | 1,200 | 1,227 | 1,161 | 1,278 |
| TOTAL | 3,909 | 4,017 | 3,859 | 4,053 | 4,176 |
FY2018 Spending Category Chart
