|
FY2018 House 1 |
FY2018 House Final |
FY2018 Senate Final |
FY2018 GAA |
|
|---|---|---|---|---|
| Budget Tracking | 83,182,921 | 83,182,921 | 83,182,921 | 71,730,289 |
|
FY2015 GAA |
FY2016 GAA |
FY2017 GAA |
FY2017 Projected |
FY2018 GAA |
|
|---|---|---|---|---|---|
| Historical Budget Levels | 34,318,000 | 49,412,000 | 71,646,393 | 61,646,393 | 71,730,289 |
* GAA is General Appropriation Act.
| SPENDING CATEGORY |
FY2014 Expended |
FY2015 Expended |
FY2016 Expended |
FY2017 Projected |
FY2018 GAA |
|---|---|---|---|---|---|
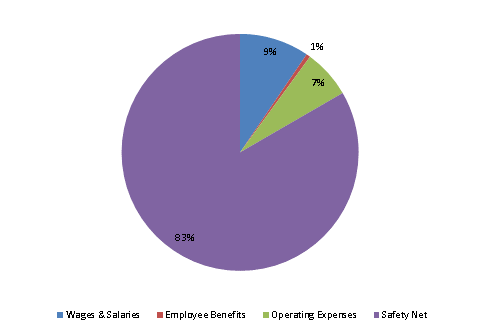
| Wages & Salaries | 0 | 2,680 | 4,372 | 6,526 | 6,811 |
| Employee Benefits | 0 | 160 | 257 | 392 | 393 |
| Operating Expenses | 0 | 1,926 | 7,700 | 7,262 | 4,738 |
| Safety Net | 0 | 24,929 | 35,197 | 47,466 | 59,788 |
| TOTAL | 0 | 29,695 | 47,527 | 61,646 | 71,730 |
FY2018 Spending Category Chart
