|
FY2018 House 1 |
FY2018 House Final |
FY2018 Senate Final |
FY2018 GAA |
|
|---|---|---|---|---|
| Budget Tracking | 247,337,564 | 247,337,564 | 247,337,564 | 247,337,564 |
|
FY2015 GAA |
FY2016 GAA |
FY2017 GAA |
FY2017 Projected |
FY2018 GAA |
|
|---|---|---|---|---|---|
| Historical Budget Levels | 207,371,693 | 221,798,049 | 236,377,183 | 236,377,183 | 247,337,564 |
* GAA is General Appropriation Act.
| SPENDING CATEGORY |
FY2014 Expended |
FY2015 Expended |
FY2016 Expended |
FY2017 Projected |
FY2018 GAA |
|---|---|---|---|---|---|
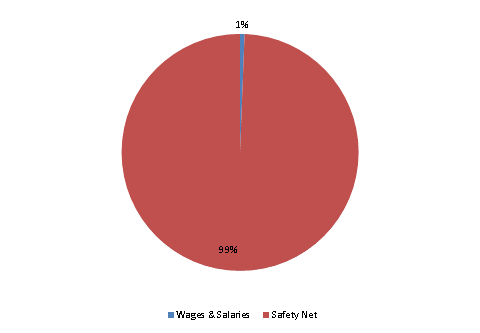
| Wages & Salaries | 2,132 | 2,648 | 2,685 | 1,500 | 1,500 |
| Employee Benefits | 19 | 29 | 28 | 0 | 0 |
| Operating Expenses | 237 | 282 | 847 | 0 | 0 |
| Safety Net | 200,694 | 204,333 | 217,507 | 234,877 | 245,838 |
| TOTAL | 203,082 | 207,292 | 221,066 | 236,377 | 247,338 |
FY2018 Spending Category Chart
