|
FY2018 House 1 |
FY2018 House Final |
FY2018 Senate Final |
FY2018 GAA |
|
|---|---|---|---|---|
| Budget Tracking | 1,683,000 | 1,683,000 | 1,683,000 | 1,632,510 |
|
FY2015 GAA |
FY2016 GAA |
FY2017 GAA |
FY2017 Projected |
FY2018 GAA |
|
|---|---|---|---|---|---|
| Historical Budget Levels | 1,749,928 | 1,783,088 | 1,700,000 | 1,683,000 | 1,632,510 |
* GAA is General Appropriation Act.
| SPENDING CATEGORY |
FY2014 Expended |
FY2015 Expended |
FY2016 Expended |
FY2017 Projected |
FY2018 GAA |
|---|---|---|---|---|---|
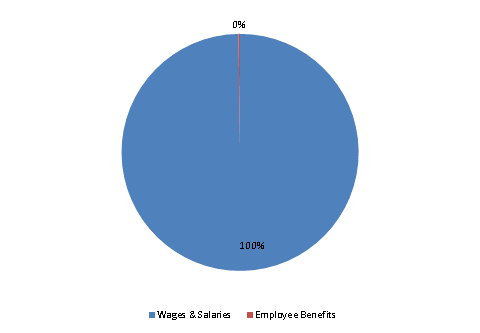
| Wages & Salaries | 231 | 1,660 | 1,616 | 1,679 | 1,629 |
| Employee Benefits | 3 | 4 | 3 | 4 | 3 |
| Operating Expenses | 1 | 1 | 50 | 0 | 0 |
| TOTAL | 235 | 1,664 | 1,669 | 1,683 | 1,633 |
FY2018 Spending Category Chart
