|
FY2018 House 1 |
FY2018 House Final |
FY2018 Senate Final |
FY2018 GAA |
|
|---|---|---|---|---|
| Budget Tracking | 31,962,455 | 30,712,455 | 31,862,455 | 30,112,455 |
|
FY2015 GAA |
FY2016 GAA |
FY2017 GAA |
FY2017 Projected |
FY2018 GAA |
|
|---|---|---|---|---|---|
| Historical Budget Levels | 0 | 0 | 32,396,637 | 30,004,497 | 30,112,455 |
* GAA is General Appropriation Act.
| SPENDING CATEGORY |
FY2014 Expended |
FY2015 Expended |
FY2016 Expended |
FY2017 Projected |
FY2018 GAA |
|---|---|---|---|---|---|
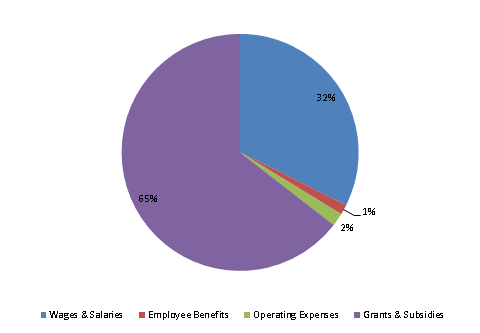
| Wages & Salaries | 0 | 0 | 0 | 8,521 | 9,738 |
| Employee Benefits | 0 | 0 | 0 | 439 | 413 |
| Operating Expenses | 0 | 0 | 0 | 479 | 544 |
| Grants & Subsidies | 0 | 0 | 0 | 20,490 | 19,417 |
| Debt Service | 0 | 0 | 0 | 75 | 0 |
| TOTAL | 0 | 0 | 0 | 30,004 | 30,112 |
FY2018 Spending Category Chart
