|
FY2018 House 1 |
FY2018 House Final |
FY2018 Senate Final |
FY2018 GAA |
|
|---|---|---|---|---|
| Budget Tracking | 5,686,617 | 5,736,618 | 5,761,617 | 5,761,617 |
|
FY2015 GAA |
FY2016 GAA |
FY2017 GAA |
FY2017 Projected |
FY2018 GAA |
|
|---|---|---|---|---|---|
| Historical Budget Levels | 13,365,851 | 13,813,060 | 5,666,766 | 5,407,702 | 5,761,617 |
* GAA is General Appropriation Act.
| SPENDING CATEGORY |
FY2014 Expended |
FY2015 Expended |
FY2016 Expended |
FY2017 Projected |
FY2018 GAA |
|---|---|---|---|---|---|
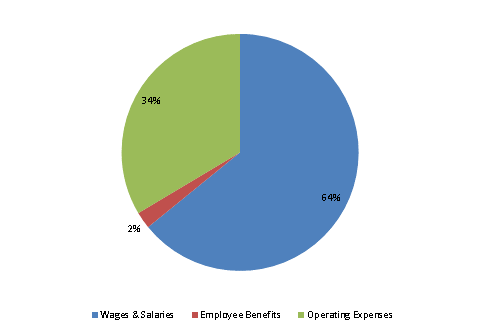
| Wages & Salaries | 10,622 | 11,136 | 9,659 | 3,559 | 3,695 |
| Employee Benefits | 488 | 529 | 492 | 130 | 133 |
| Operating Expenses | 1,684 | 1,563 | 1,547 | 1,719 | 1,934 |
| Debt Service | 0 | 0 | 0 | 0 | 0 |
| TOTAL | 12,793 | 13,228 | 11,698 | 5,408 | 5,762 |
FY2018 Spending Category Chart
