|
FY2018 House 1 |
FY2018 House Final |
FY2018 Senate Final |
FY2018 GAA |
|
|---|---|---|---|---|
| Budget Tracking | 35,163,728 | 36,913,728 | 39,863,728 | 37,163,712 |
|
FY2015 GAA |
FY2016 GAA |
FY2017 GAA |
FY2017 Projected |
FY2018 GAA |
|
|---|---|---|---|---|---|
| Historical Budget Levels | 44,344,381 | 41,161,322 | 41,473,430 | 35,842,297 | 37,163,712 |
* GAA is General Appropriation Act.
| SPENDING CATEGORY |
FY2014 Expended |
FY2015 Expended |
FY2016 Expended |
FY2017 Projected |
FY2018 GAA |
|---|---|---|---|---|---|
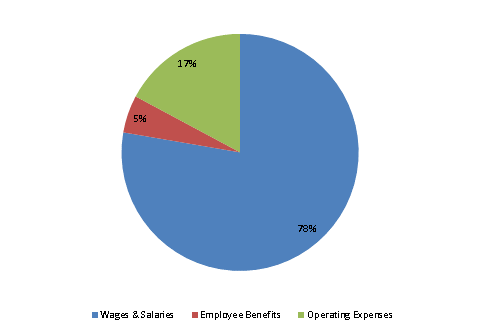
| Wages & Salaries | 30,825 | 30,957 | 29,637 | 27,937 | 28,877 |
| Employee Benefits | 1,523 | 1,771 | 1,612 | 1,800 | 1,904 |
| Operating Expenses | 8,683 | 7,523 | 7,085 | 5,967 | 6,383 |
| Grants & Subsidies | 1,620 | 114 | 324 | 0 | 0 |
| Debt Service | 0 | 0 | 0 | 138 | 0 |
| TOTAL | 42,651 | 40,365 | 38,658 | 35,842 | 37,164 |
FY2018 Spending Category Chart
