|
FY2018 House 1 |
FY2018 House Final |
FY2018 Senate Final |
FY2018 GAA |
|
|---|---|---|---|---|
| Budget Tracking | 15,466,544 | 15,666,544 | 15,566,544 | 15,560,192 |
|
FY2015 GAA |
FY2016 GAA |
FY2017 GAA |
FY2017 Projected |
FY2018 GAA |
|
|---|---|---|---|---|---|
| Historical Budget Levels | 15,280,812 | 14,772,699 | 15,695,936 | 15,095,008 | 15,560,192 |
* GAA is General Appropriation Act.
| SPENDING CATEGORY |
FY2014 Expended |
FY2015 Expended |
FY2016 Expended |
FY2017 Projected |
FY2018 GAA |
|---|---|---|---|---|---|
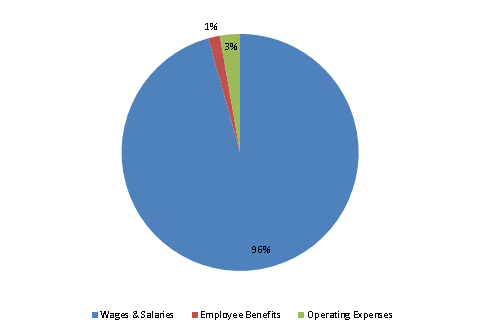
| Wages & Salaries | 12,116 | 14,241 | 13,948 | 14,427 | 14,886 |
| Employee Benefits | 175 | 230 | 235 | 244 | 247 |
| Operating Expenses | 322 | 349 | 359 | 424 | 427 |
| TOTAL | 12,614 | 14,820 | 14,542 | 15,095 | 15,560 |
FY2018 Spending Category Chart
