|
FY2018 House 1 |
FY2018 House Final |
FY2018 Senate Final |
FY2018 GAA |
|
|---|---|---|---|---|
| Budget Tracking | 4,237,773 | 4,712,773 | 4,507,773 | 4,671,626 |
|
FY2015 GAA |
FY2016 GAA |
FY2017 GAA |
FY2017 Projected |
FY2018 GAA |
|
|---|---|---|---|---|---|
| Historical Budget Levels | 4,353,899 | 4,586,687 | 4,226,626 | 4,232,381 | 4,671,626 |
* GAA is General Appropriation Act.
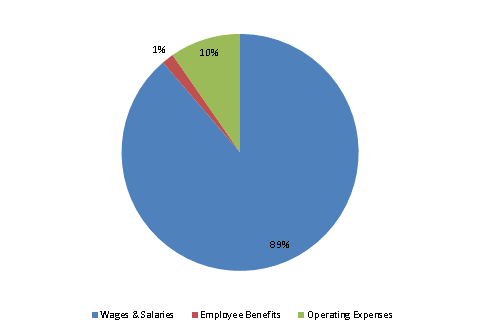
| SPENDING CATEGORY |
FY2014 Expended |
FY2015 Expended |
FY2016 Expended |
FY2017 Projected |
FY2018 GAA |
|---|---|---|---|---|---|
| Wages & Salaries | 3,635 | 3,868 | 3,676 | 3,755 | 4,144 |
| Employee Benefits | 208 | 70 | 66 | 69 | 76 |
| Operating Expenses | 400 | 397 | 396 | 409 | 451 |
| TOTAL | 4,244 | 4,335 | 4,137 | 4,232 | 4,672 |
FY2018 Spending Category Chart