|
FY2018 House 1 |
FY2018 House Final |
FY2018 Senate Final |
FY2018 GAA |
|
|---|---|---|---|---|
| Budget Tracking | 17,000,000 | 17,685,000 | 17,600,000 | 17,673,831 |
|
FY2015 GAA |
FY2016 GAA |
FY2017 GAA |
FY2017 Projected |
FY2018 GAA |
|
|---|---|---|---|---|---|
| Historical Budget Levels | 15,050,000 | 15,000,000 | 17,665,000 | 17,000,000 | 17,673,831 |
* GAA is General Appropriation Act.
| SPENDING CATEGORY |
FY2014 Expended |
FY2015 Expended |
FY2016 Expended |
FY2017 Projected |
FY2018 GAA |
|---|---|---|---|---|---|
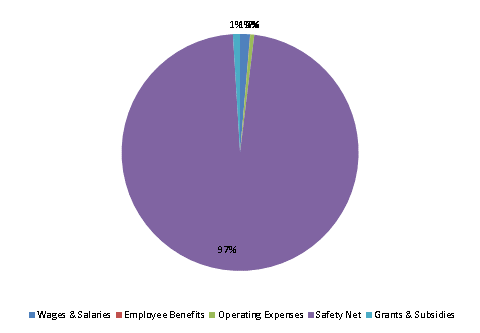
| Wages & Salaries | 163 | 184 | 224 | 230 | 239 |
| Employee Benefits | 3 | 4 | 5 | 5 | 5 |
| Operating Expenses | 94 | 92 | 91 | 92 | 96 |
| Safety Net | 13,740 | 14,705 | 16,680 | 16,508 | 17,163 |
| Grants & Subsidies | 0 | 50 | 160 | 165 | 172 |
| TOTAL | 14,000 | 15,035 | 17,160 | 17,000 | 17,674 |
FY2018 Spending Category Chart
