|
FY2018 House 1 |
FY2018 House Final |
FY2018 Senate Final |
FY2018 GAA |
|
|---|---|---|---|---|
| Budget Tracking | 5,467,651 | 5,817,651 | 5,892,651 | 5,830,341 |
|
FY2015 GAA |
FY2016 GAA |
FY2017 GAA |
FY2017 Projected |
FY2018 GAA |
|
|---|---|---|---|---|---|
| Historical Budget Levels | 5,686,193 | 5,779,539 | 5,629,445 | 5,494,175 | 5,830,341 |
* GAA is General Appropriation Act.
| SPENDING CATEGORY |
FY2014 Expended |
FY2015 Expended |
FY2016 Expended |
FY2017 Projected |
FY2018 GAA |
|---|---|---|---|---|---|
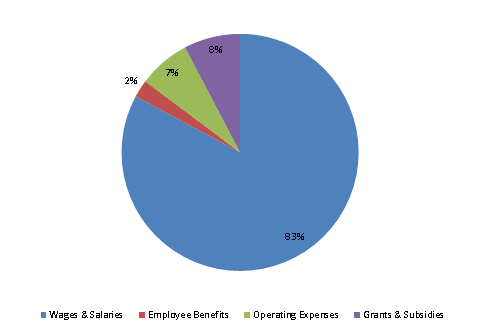
| Wages & Salaries | 4,304 | 4,523 | 4,280 | 4,458 | 4,830 |
| Employee Benefits | 98 | 114 | 116 | 130 | 139 |
| Operating Expenses | 551 | 397 | 582 | 486 | 413 |
| Grants & Subsidies | 350 | 470 | 532 | 420 | 448 |
| Debt Service | 0 | 0 | 0 | 0 | 0 |
| TOTAL | 5,303 | 5,504 | 5,510 | 5,494 | 5,830 |
FY2018 Spending Category Chart
