|
FY2018 House 1 |
FY2018 House Final |
FY2018 Senate Final |
FY2018 GAA |
|
|---|---|---|---|---|
| Budget Tracking | 1,306,079 | 1,306,079 | 1,306,079 | 1,306,079 |
|
FY2015 GAA |
FY2016 GAA |
FY2017 GAA |
FY2017 Projected |
FY2018 GAA |
|
|---|---|---|---|---|---|
| Historical Budget Levels | 1,340,766 | 1,344,430 | 1,320,159 | 2,320,159 | 1,306,079 |
* GAA is General Appropriation Act.
| SPENDING CATEGORY |
FY2014 Expended |
FY2015 Expended |
FY2016 Expended |
FY2017 Projected |
FY2018 GAA |
|---|---|---|---|---|---|
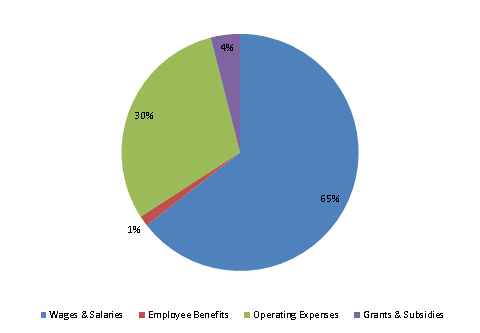
| Wages & Salaries | 646 | 698 | 814 | 856 | 842 |
| Employee Benefits | 16 | 15 | 17 | 19 | 18 |
| Operating Expenses | 227 | 345 | 338 | 394 | 394 |
| Grants & Subsidies | 0 | 99 | 59 | 1,052 | 52 |
| TOTAL | 890 | 1,158 | 1,228 | 2,320 | 1,306 |
FY2018 Spending Category Chart
