|
FY2018 House 1 |
FY2018 House Final |
FY2018 Senate Final |
FY2018 GAA |
|
|---|---|---|---|---|
| Budget Tracking | 12,413,688 | 12,413,688 | 12,413,688 | 12,324,125 |
|
FY2015 GAA |
FY2016 GAA |
FY2017 GAA |
FY2017 Projected |
FY2018 GAA |
|
|---|---|---|---|---|---|
| Historical Budget Levels | 13,944,080 | 14,673,215 | 12,330,404 | 12,206,460 | 12,324,125 |
* GAA is General Appropriation Act.
| SPENDING CATEGORY |
FY2014 Expended |
FY2015 Expended |
FY2016 Expended |
FY2017 Projected |
FY2018 GAA |
|---|---|---|---|---|---|
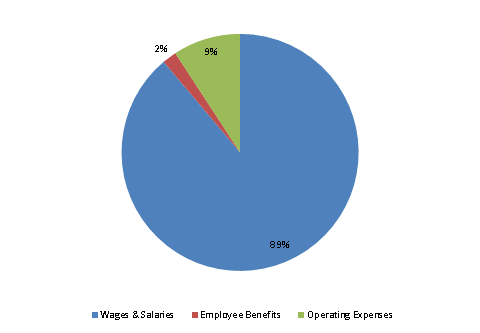
| Wages & Salaries | 12,291 | 12,568 | 10,665 | 10,899 | 10,949 |
| Employee Benefits | 187 | 217 | 190 | 207 | 239 |
| Operating Expenses | 1,077 | 1,005 | 922 | 1,100 | 1,135 |
| TOTAL | 13,555 | 13,791 | 11,776 | 12,206 | 12,324 |
FY2018 Spending Category Chart
