|
FY2018 House 1 |
FY2018 House Final |
FY2018 Senate Final |
FY2018 GAA |
|
|---|---|---|---|---|
| Budget Tracking | 24,408,940 | 24,958,940 | 26,025,000 | 24,733,484 |
|
FY2015 GAA |
FY2016 GAA |
FY2017 GAA |
FY2017 Projected |
FY2018 GAA |
|
|---|---|---|---|---|---|
| Historical Budget Levels | 29,003,667 | 27,946,811 | 25,037,437 | 23,890,800 | 24,733,484 |
* GAA is General Appropriation Act.
| SPENDING CATEGORY |
FY2014 Expended |
FY2015 Expended |
FY2016 Expended |
FY2017 Projected |
FY2018 GAA |
|---|---|---|---|---|---|
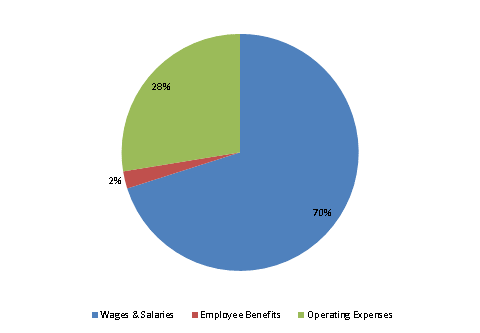
| Wages & Salaries | 20,569 | 21,705 | 17,752 | 17,072 | 17,330 |
| Employee Benefits | 507 | 564 | 460 | 499 | 583 |
| Operating Expenses | 5,669 | 6,589 | 5,920 | 6,320 | 6,820 |
| Grants & Subsidies | 482 | 0 | 275 | 0 | 0 |
| TOTAL | 27,227 | 28,858 | 24,407 | 23,891 | 24,733 |
FY2018 Spending Category Chart
