|
FY2018 House 1 |
FY2018 House Final |
FY2018 Senate Final |
FY2018 GAA |
|
|---|---|---|---|---|
| Budget Tracking | 10,342,041 | 10,342,041 | 10,342,041 | 10,207,525 |
|
FY2015 GAA |
FY2016 GAA |
FY2017 GAA |
FY2017 Projected |
FY2018 GAA |
|
|---|---|---|---|---|---|
| Historical Budget Levels | 9,640,023 | 9,984,755 | 10,073,008 | 10,073,008 | 10,207,525 |
* GAA is General Appropriation Act.
| SPENDING CATEGORY |
FY2014 Expended |
FY2015 Expended |
FY2016 Expended |
FY2017 Projected |
FY2018 GAA |
|---|---|---|---|---|---|
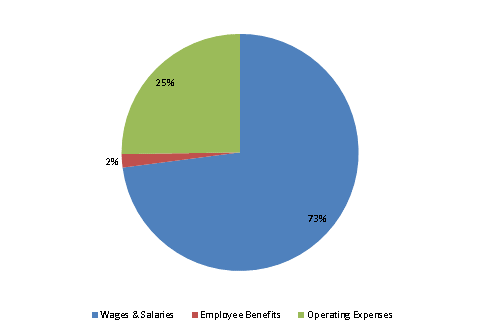
| Wages & Salaries | 6,573 | 6,694 | 7,045 | 7,346 | 7,446 |
| Employee Benefits | 190 | 215 | 200 | 187 | 186 |
| Operating Expenses | 1,894 | 2,086 | 2,456 | 2,540 | 2,576 |
| TOTAL | 8,657 | 8,996 | 9,700 | 10,073 | 10,208 |
FY2018 Spending Category Chart
