|
FY2018 House 1 |
FY2018 House Final |
FY2018 Senate Final |
FY2018 GAA |
|
|---|---|---|---|---|
| Budget Tracking | 9,746,402 | 9,046,322 | 9,846,402 | 8,196,322 |
|
FY2015 GAA |
FY2016 GAA |
FY2017 GAA |
FY2017 Projected |
FY2018 GAA |
|
|---|---|---|---|---|---|
| Historical Budget Levels | 6,415,834 | 6,211,774 | 7,672,881 | 7,294,023 | 8,196,322 |
* GAA is General Appropriation Act.
| SPENDING CATEGORY |
FY2014 Expended |
FY2015 Expended |
FY2016 Expended |
FY2017 Projected |
FY2018 GAA |
|---|---|---|---|---|---|
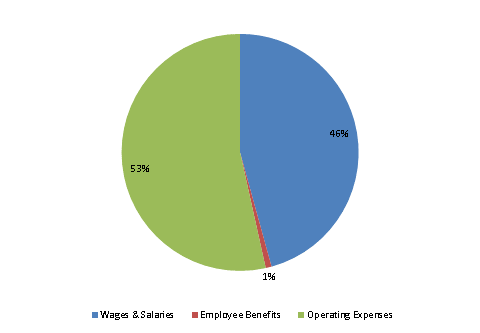
| Wages & Salaries | 1,930 | 2,435 | 1,832 | 3,193 | 3,748 |
| Employee Benefits | 33 | 46 | 37 | 59 | 66 |
| Operating Expenses | 3,790 | 3,351 | 3,968 | 4,042 | 4,383 |
| TOTAL | 5,753 | 5,832 | 5,837 | 7,294 | 8,196 |
FY2018 Spending Category Chart
