|
FY2018 House 1 |
FY2018 House Final |
FY2018 Senate Final |
FY2018 GAA |
|
|---|---|---|---|---|
| Budget Tracking | 3,222,634 | 3,222,634 | 3,052,634 | 2,952,634 |
|
FY2015 GAA |
FY2016 GAA |
FY2017 GAA |
FY2017 Projected |
FY2018 GAA |
|
|---|---|---|---|---|---|
| Historical Budget Levels | 3,409,659 | 3,642,770 | 3,225,786 | 3,193,528 | 2,952,634 |
* GAA is General Appropriation Act.
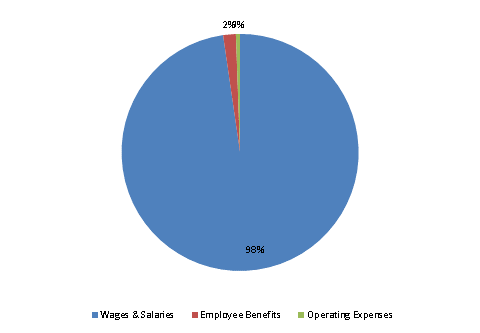
| SPENDING CATEGORY |
FY2014 Expended |
FY2015 Expended |
FY2016 Expended |
FY2017 Projected |
FY2018 GAA |
|---|---|---|---|---|---|
| Wages & Salaries | 3,143 | 3,213 | 1,878 | 3,120 | 2,885 |
| Employee Benefits | 45 | 51 | 32 | 56 | 51 |
| Operating Expenses | 23 | 19 | 16 | 18 | 17 |
| TOTAL | 3,211 | 3,283 | 1,926 | 3,194 | 2,953 |
FY2018 Spending Category Chart