|
FY2018 House 1 |
FY2018 House Final |
FY2018 Senate Final |
FY2018 GAA |
|
|---|---|---|---|---|
| Budget Tracking | 150,000 | 150,000 | 100,000 | 100,000 |
|
FY2015 GAA |
FY2016 GAA |
FY2017 GAA |
FY2017 Projected |
FY2018 GAA |
|
|---|---|---|---|---|---|
| Historical Budget Levels | 500,000 | 150,001 | 150,000 | 120,000 | 100,000 |
* GAA is General Appropriation Act.
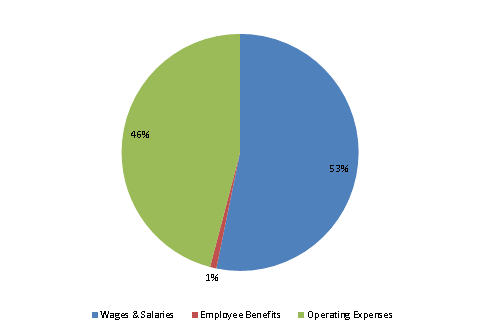
| SPENDING CATEGORY |
FY2014 Expended |
FY2015 Expended |
FY2016 Expended |
FY2017 Projected |
FY2018 GAA |
|---|---|---|---|---|---|
| Wages & Salaries | 245 | 0 | 75 | 79 | 53 |
| Employee Benefits | 3 | 2 | 1 | 1 | 1 |
| Operating Expenses | 9 | 3 | 0 | 40 | 46 |
| TOTAL | 258 | 5 | 76 | 120 | 100 |
FY2018 Spending Category Chart