|
FY2018 House 1 |
FY2018 House Final |
FY2018 Senate Final |
FY2018 GAA |
|
|---|---|---|---|---|
| Budget Tracking | 10,703,140 | 10,703,140 | 10,703,140 | 10,703,140 |
|
FY2015 GAA |
FY2016 GAA |
FY2017 GAA |
FY2017 Projected |
FY2018 GAA |
|
|---|---|---|---|---|---|
| Historical Budget Levels | 9,146,607 | 12,306,022 | 11,300,283 | 10,306,913 | 10,703,140 |
* GAA is General Appropriation Act.
| SPENDING CATEGORY |
FY2014 Expended |
FY2015 Expended |
FY2016 Expended |
FY2017 Projected |
FY2018 GAA |
|---|---|---|---|---|---|
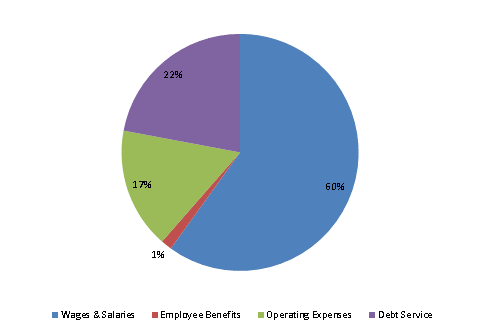
| Wages & Salaries | 3,331 | 5,020 | 5,170 | 6,055 | 6,416 |
| Employee Benefits | 50 | 99 | 109 | 121 | 159 |
| Operating Expenses | 1,679 | 2,161 | 1,521 | 1,770 | 1,767 |
| Debt Service | 0 | 0 | 2,361 | 2,361 | 2,361 |
| TOTAL | 5,059 | 7,281 | 9,161 | 10,307 | 10,703 |
FY2018 Spending Category Chart
