|
FY2018 House 1 |
FY2018 House Final |
FY2018 Senate Final |
FY2018 GAA |
|
|---|---|---|---|---|
| Budget Tracking | 3,018,811 | 3,018,811 | 2,918,811 | 2,801,537 |
|
FY2015 GAA |
FY2016 GAA |
FY2017 GAA |
FY2017 Projected |
FY2018 GAA |
|
|---|---|---|---|---|---|
| Historical Budget Levels | 3,138,645 | 2,968,836 | 2,801,537 | 2,792,235 | 2,801,537 |
* GAA is General Appropriation Act.
| SPENDING CATEGORY |
FY2014 Expended |
FY2015 Expended |
FY2016 Expended |
FY2017 Projected |
FY2018 GAA |
|---|---|---|---|---|---|
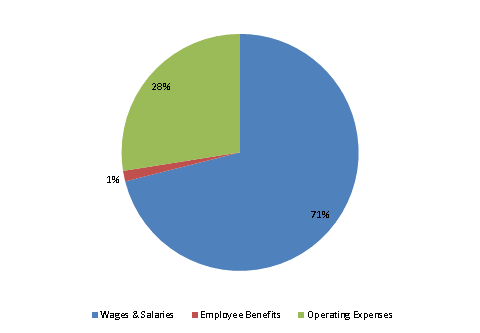
| Wages & Salaries | 2,398 | 2,858 | 2,827 | 1,724 | 1,991 |
| Employee Benefits | 42 | 53 | 55 | 40 | 41 |
| Operating Expenses | 61 | 54 | 50 | 1,028 | 770 |
| TOTAL | 2,501 | 2,965 | 2,932 | 2,792 | 2,802 |
FY2018 Spending Category Chart
