|
FY2018 House 1 |
FY2018 House Final |
FY2018 Senate Final |
FY2018 GAA |
|
|---|---|---|---|---|
| Budget Tracking | 5,020,641 | 4,306,641 | 4,594,641 | 4,556,641 |
|
FY2015 GAA |
FY2016 GAA |
FY2017 GAA |
FY2017 Projected |
FY2018 GAA |
|
|---|---|---|---|---|---|
| Historical Budget Levels | 3,028,520 | 3,073,641 | 3,795,641 | 3,252,479 | 4,556,641 |
* GAA is General Appropriation Act.
| SPENDING CATEGORY |
FY2014 Expended |
FY2015 Expended |
FY2016 Expended |
FY2017 Projected |
FY2018 GAA |
|---|---|---|---|---|---|
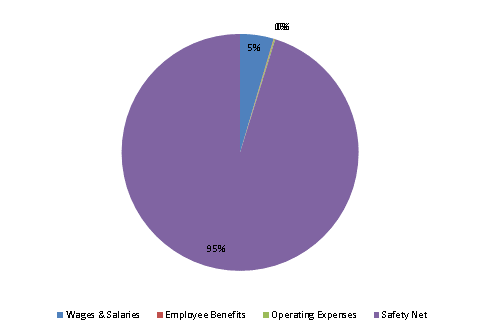
| Wages & Salaries | 257 | 209 | 230 | 93 | 208 |
| Employee Benefits | 3 | 3 | 4 | 4 | 3 |
| Operating Expenses | 4 | 73 | 70 | 1 | 7 |
| Safety Net | 2,043 | 2,535 | 2,929 | 3,155 | 4,338 |
| TOTAL | 2,308 | 2,820 | 3,232 | 3,252 | 4,557 |
FY2018 Spending Category Chart
