|
FY2018 House 1 |
FY2018 House Final |
FY2018 Senate Final |
FY2018 GAA |
|
|---|---|---|---|---|
| Budget Tracking | 3,759,629 | 3,529,629 | 3,759,629 | 3,844,629 |
|
FY2015 GAA |
FY2016 GAA |
FY2017 GAA |
FY2017 Projected |
FY2018 GAA |
|
|---|---|---|---|---|---|
| Historical Budget Levels | 3,051,269 | 3,389,266 | 3,762,497 | 3,412,597 | 3,844,629 |
* GAA is General Appropriation Act.
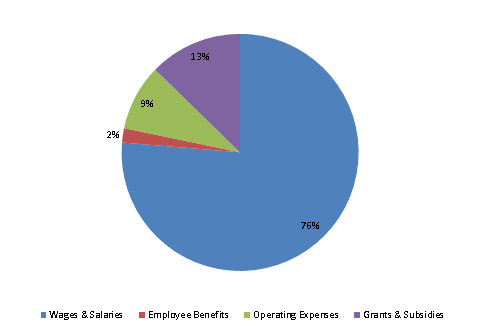
| SPENDING CATEGORY |
FY2014 Expended |
FY2015 Expended |
FY2016 Expended |
FY2017 Projected |
FY2018 GAA |
|---|---|---|---|---|---|
| Wages & Salaries | 2,073 | 2,007 | 2,229 | 2,483 | 2,935 |
| Employee Benefits | 44 | 45 | 51 | 112 | 74 |
| Operating Expenses | 324 | 507 | 320 | 339 | 347 |
| Grants & Subsidies | 467 | 604 | 298 | 478 | 488 |
| TOTAL | 2,908 | 3,163 | 2,898 | 3,413 | 3,845 |
FY2018 Spending Category Chart