|
FY2018 House 1 |
FY2018 House Final |
FY2018 Senate Final |
FY2018 GAA |
|
|---|---|---|---|---|
| Budget Tracking | 29,170,467 | 29,170,466 | 29,170,467 | 28,295,352 |
|
FY2015 GAA |
FY2016 GAA |
FY2017 GAA |
FY2017 Projected |
FY2018 GAA |
|
|---|---|---|---|---|---|
| Historical Budget Levels | 37,972,534 | 34,343,885 | 29,371,521 | 29,438,647 | 28,295,352 |
* GAA is General Appropriation Act.
| SPENDING CATEGORY |
FY2014 Expended |
FY2015 Expended |
FY2016 Expended |
FY2017 Projected |
FY2018 GAA |
|---|---|---|---|---|---|
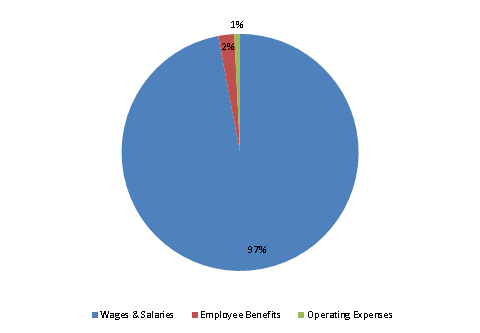
| Wages & Salaries | 35,180 | 32,245 | 29,248 | 28,800 | 27,455 |
| Employee Benefits | 634 | 656 | 600 | 637 | 620 |
| Operating Expenses | 1 | 1 | 0 | 2 | 221 |
| TOTAL | 35,815 | 32,902 | 29,848 | 29,439 | 28,295 |
FY2018 Spending Category Chart
