|
FY2018 House 1 |
FY2018 House Final |
FY2018 Senate Final |
FY2018 GAA |
|
|---|---|---|---|---|
| Budget Tracking | 27,938,953 | 27,938,953 | 27,938,953 | 27,938,953 |
|
FY2015 GAA |
FY2016 GAA |
FY2017 GAA |
FY2017 Projected |
FY2018 GAA |
|
|---|---|---|---|---|---|
| Historical Budget Levels | 27,938,953 | 27,938,953 | 27,938,953 | 27,581,832 | 27,938,953 |
* GAA is General Appropriation Act.
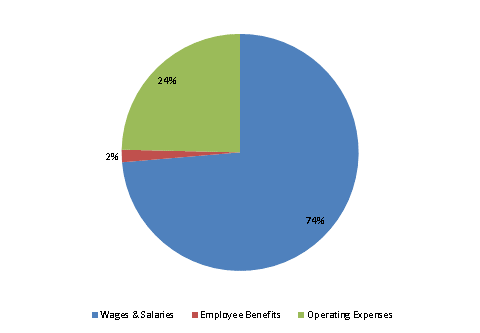
| SPENDING CATEGORY |
FY2014 Expended |
FY2015 Expended |
FY2016 Expended |
FY2017 Projected |
FY2018 GAA |
|---|---|---|---|---|---|
| Wages & Salaries | 15,880 | 19,405 | 19,475 | 20,319 | 20,582 |
| Employee Benefits | 442 | 540 | 502 | 474 | 473 |
| Operating Expenses | 11,300 | 7,876 | 6,810 | 6,789 | 6,885 |
| TOTAL | 27,621 | 27,820 | 26,787 | 27,582 | 27,939 |
FY2018 Spending Category Chart