|
FY2018 House 1 |
FY2018 House Final |
FY2018 Senate Final |
FY2018 GAA |
|
|---|---|---|---|---|
| Budget Tracking | 80,667,252 | 78,621,998 | 79,667,252 | 78,621,998 |
|
FY2015 GAA |
FY2016 GAA |
FY2017 GAA |
FY2017 Projected |
FY2018 GAA |
|
|---|---|---|---|---|---|
| Historical Budget Levels | 94,179,565 | 88,872,929 | 76,436,443 | 75,784,332 | 78,621,998 |
* GAA is General Appropriation Act.
| SPENDING CATEGORY |
FY2014 Expended |
FY2015 Expended |
FY2016 Expended |
FY2017 Projected |
FY2018 GAA |
|---|---|---|---|---|---|
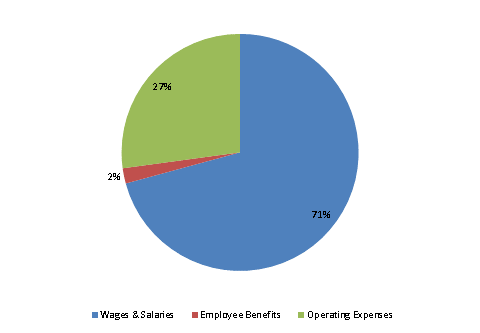
| Wages & Salaries | 72,616 | 71,152 | 59,674 | 58,889 | 55,641 |
| Employee Benefits | 1,803 | 1,915 | 1,621 | 1,683 | 1,636 |
| Operating Expenses | 15,092 | 16,412 | 15,655 | 15,212 | 21,345 |
| TOTAL | 89,512 | 89,479 | 76,950 | 75,784 | 78,622 |
FY2018 Spending Category Chart
