|
FY2018 House 1 |
FY2018 House Final |
FY2018 Senate Final |
FY2018 GAA |
|
|---|---|---|---|---|
| Budget Tracking | 1,191,079 | 1,191,079 | 1,191,079 | 1,147,356 |
|
FY2015 GAA |
FY2016 GAA |
FY2017 GAA |
FY2017 Projected |
FY2018 GAA |
|
|---|---|---|---|---|---|
| Historical Budget Levels | 1,238,949 | 1,220,365 | 1,103,633 | 1,103,633 | 1,147,356 |
* GAA is General Appropriation Act.
| SPENDING CATEGORY |
FY2014 Expended |
FY2015 Expended |
FY2016 Expended |
FY2017 Projected |
FY2018 GAA |
|---|---|---|---|---|---|
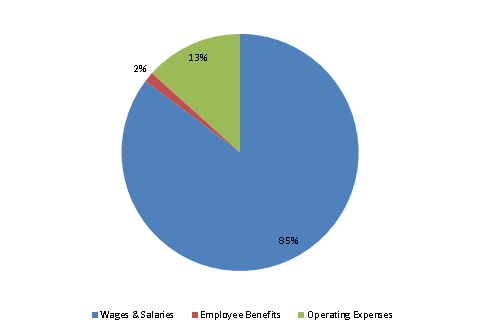
| Wages & Salaries | 935 | 1,028 | 1,040 | 953 | 978 |
| Employee Benefits | 14 | 17 | 18 | 17 | 16 |
| Operating Expenses | 132 | 139 | 139 | 134 | 153 |
| TOTAL | 1,082 | 1,183 | 1,197 | 1,104 | 1,147 |
FY2018 Spending Category Chart
